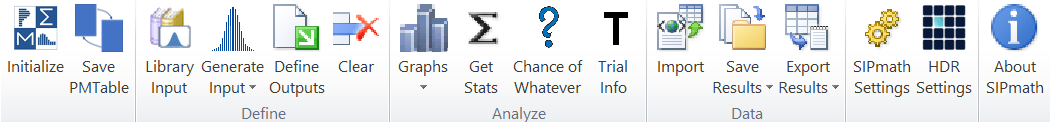
New 4.0 Enterprise SIPmath Modeler Tools

Herman Kahn
Scenario Analysis
Scenario analysis was invented by futurist Herman Kahn in the 1950s at the Rand Corporation. He was a friend of my dad’s and I remember him vividly from early childhood as energetic, humorous, and rotund. Perhaps not traits one would expect in the author of On Thermonuclear War, his controversial 1960 treatise of war in the nuclear age, which introduced the Doomsday Machine. In fact, Kahn is one of the characters upon whom Dr. Strangelove (of the movie) is based.
Scenario analysis involves forecasting major political and economic shifts through a few self-consistent narratives around potential futures. One does not specify probabilities of these scenarios up front but uses them to guide analysis into the unknown.
Scenario analysis has been widely used at Royal Dutch Shell and has been credited with preparing the company for the collapse of the Soviet Union. Here is a short docudrama of how it occurred.
“What would happen if the Soviet Union Collapsed?” … “Get out of town.” … “But what if it did?” … “That’s ridiculous!” … “But what if it did?” . . . . . . . . . . . . . “Maybe we’d better think this through.”
I am all for the out-of-the-box thinking that scenario analysis encourages. But if each of your handful of scenarios is rooted in the Flaw of Averages, where are you? Among other new features, the latest SIPmath Tools make it easy to combine interactive Monte Carlo with scenario analysis for the best of both worlds.
An Application – Climate Smart Agriculture
We have been assisting a team of environmental scientists at World Agroforestry (ICRAF) in exploring sets of climate smart agriculture projects in Africa, which will be the subject of a future webinar. Because all of these projects coexist in the same uncertain environment, there are strong portfolio effects, which can be modeled well with coherent SIP libraries. But beyond the sorts of uncertainties that are amenable to Monte Carlo simulation, there are potential world scenarios involving political upheaval, carbon pricing, etc., for which it is difficult to estimate probabilities. Therefore, we added the capability to the SIPmath Modeler Tools to run the same simulation through multiple experiments. You can then quickly scroll through either different portfolios of projects in one world scenario, or the same portfolio in multiple scenarios as shown in the graphics below.

Changing Portfolios

Changing Scenarios
Free Webinars
Brian Putt, our Chair of Energy Applications, and I will be offering a series of ongoing free webinars on the new SIPmath Tools. For a limited time, attendees will have the option to purchase the Enterprise Tools at a 30% discount, $150 off the regular price of $500. The first three webinars are listed below.
Introduction to the 4.0 Tools
This webinar will start with the basics of using either the Free or Enterprise versions of the SIPmath Modeler Tools for Excel. We will then briefly describe the exciting new features of the 4th generation tools below.
Advanced HDR generator from Hubbard Decision Research
Scatterplots of input and output cells
Multi-scenario simulation and multi-scenario libraries
Save and retrieve PMTable sheets for advanced analysis
Scenario Analysis on Steroids
This webinar will show how to create scenarios based on several variables such as discount rates, price levels, political upheaval, etc., which may easily be run through a single simulation model. The new Repeated Save command, coupled to Danny O’Neil’s “Enigma” formulas, automatically creates SIP Libraries containing multiple scenarios. These may be accessed by other models that can in turn filter the results by scenario. Topics include:
Using the HDR Generator to coordinate models
The “Enigma” formulas for performing experiments with arbitrary numbers of variables
The Repeated Save command
Filtering the results on Input and Output
More Power to the PMTable
The PMTable sheet is the heart of SIPmath in Excel, as it is the location of the Data Table that allows the simulation to run in native Excel. This webinar will show how to use the new “Save PMTable” command, which lets you save multiple versions of your analysis. For example, you may perform a multiple output simulation, save the resulting PMTable, then run a single output multiple experiment, save that PMTable, then return to the original. This also enables complex analysis techniques to include:
Storing a base or reference case for comparison
Sensitivity analysis
Tornado diagrams
Critical path identification
© Copyright 2020 Sam L. Savage