Top Gun BayesOmatic

By Sam L. Savage

In this blog I will discuss some technical details of the BayesOmatic in the Top Gun model introduced in the last blog. Those familiar with me know that I would not have called the gauge in the model the ChanceOmeter if I hadn’t been able to purchase ChanceOmeter.com for $11, and while I was out shopping, I picked up BayesOmatic.com for the same low price.

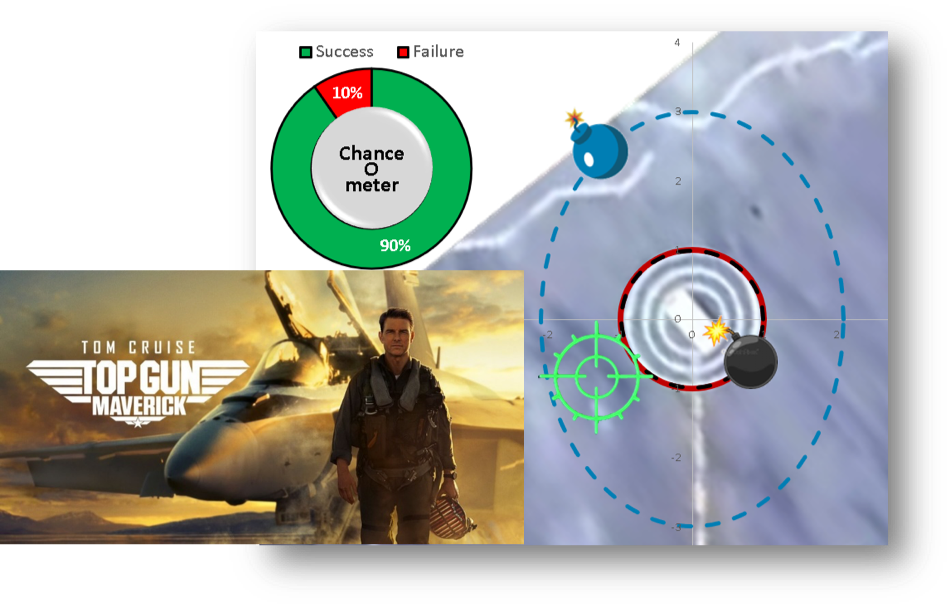
The ChanceOmeter is just a pie chart driven off of two cells on the Calculations page. The green segment is based on a cell created with the Chance of Whatever button in ChanceCalc, and the red segment is simply 1 minus the other cell.


The BayesOmatic is more complicated, especially for people who do not understand Bayesian analysis, which is approximately everybody. It calculates the chance of various outcomes of the mission given specified conditions. For example, we can calculate the chance that the mission would succeed given the malfunction of both targeting lasers. 

How it works

Bayes Theorem states that

Probability of event A given event B = Probability of events A and B ÷ Probability of event B

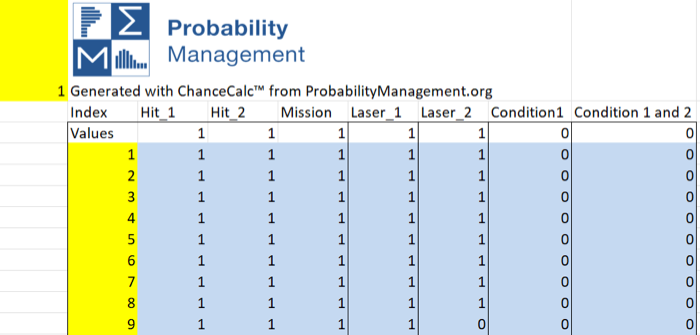
This can be viewed geometrically as the chance that a dart is in region A given that you know it has already hit B as shown.  This is elementary to do in a SIPmath model by creating Boolean (0/1) variables that signify that A has occurred, B has occurred, and that A and B have both occurred. This creates three ranges on the PMTable sheet, let’s call them A, B, and A_and_B. Because the results of the 10,000 trials are always live in the Data Table, it is easy to perform Bayesian analysis on the fly and the formula above is simply:


Probability of event A given event B = SUM(A_and_B)/SUM(B)

The actual Top Gun Data Table is shown above. Note that targeting laser 2 failed on trial 9.

The User Form

This model sets up the Boolean variables using user forms on the Top Gun sheet to drive formulas on the Calculations sheet. Even I don’t remember how I did this, but I remember where I did this, which should be enough for you to figure it out on your own.

The user controls were created with the Combo Box Form Control available on the Developer Ribbon (which must be made visible under File, Options, Customize Ribbon.) They interact with cells AF47 to AI52 on the Top Gun Sheet.

The cells above are interpreted by a bunch of formulas I hope you can figure out on the Calculations sheet located as shown below.

Note that there is a second copy of our new trial control on this sheet so you can select individual trials as you figure out the formulas above.

Bayesian Inversion

It is also easy to do what is known as Bayesian inversion. Suppose you’re back on the deck of the carrier after a successful mission, and the Maintenance Chief says: “Did you realize that both lasers malfunctioned?” “Impossible,” you say. Well, not exactly. There is a 2 tenths% chance as shown below. To understand the difference, return to the dart. It should be clear from the figure that the chance of hitting in blue given that you hit in yellow is greater than the chance of hitting in yellow given that you hit in blue.

Copyright © 2023 Sam L. Savage

TOP GUN: MAVERICK A WALK IN THE PARK OR MISSION IMPOSSIBLE?

TOP GUN: MAVERICK

A WALK IN THE PARK OR MISSION IMPOSSIBLE?

By John Button, Connor McLemore, and Sam Savage

Presuming the producers maintain this pace, we can barely wait for the 2058 release, when a 96-year-old Tom Cruise at the controls of the only remaining aircraft on Earth, his own WWII P51 Mustang (which appeared in Maverick) flies through a hail of anti-matter death particles to save the planet from the descendants of Chat GPT.


Overview

In the 2022 film sequel Top Gun: Maverick, Tom Cruise returns to the screen as Pete “Maverick” Mitchell, one of the Navy’s top aviators, to lead a specialized and seemingly impossible mission.

The screenwriters must have bent over backwards to come up with a mission that required actual humans to fly less-than-state-of-the-art aircraft at the edges of their aerobatic envelopes for a sustained period. But hey, that’s Hollywood, and we loved it as much as the original 1986 version. Presuming the producers maintain this pace, we can barely wait for the 2058 release, when a 96-year-old Tom Cruise at the controls of the only remaining aircraft on Earth, his own WWII P51 Mustang (which appeared in Maverick) flies through a hail of anti-matter death particles to save the planet from the descendants of Chat GPT.

But at ProbabilityManagement.org, we have our own seemingly impossible mission: to foster chance-informed thinking. So, in spite of being big fans of the movie, we had to ask the logical question, “How would you calculate the chances of Maverick actually pulling this off?”

Armed only with ChanceCalc, we were concerned that we could either build a trivial model that taught little, once we grabbed your attention with Tom Cruise, or a complex model that would make your eyes cross. However, after consultation with Connor McLemore, our chair of National Security Applications, and a graduate of the Navy’s actual Top Gun program, we believe we have developed a stealth model that delivers a payload of insight.

And what a great way to kick off the new Community of Practice (CoP) of Probability Management at the Military Operations Research Society as discussed in my recent blog. You can find the Top Gun ChanceOmeter and other examples on the Models tab of the MORS CoP page as well as on our own Military Readiness page.

Mission Description

“Maverick” has been authorized by the President, and tasked by the Pentagon, to lead a specialized strike team to take out the enemy’s illegal uranium plant before it is fully operational and make it back safely to tell the story. Just a walk in the park, right? Well, not quite.

The plant sits in an underground bunker, surrounded by two mountains. The strike mission in the movie is based on four complicating factors:

  • Hitting a very small target (three meters wide,) two consecutive times

  • at a very precise angle,

  • in a very steep valley,

  • in a GPS-jammed environment.


The attack strategy calls for two sections (a.k.a, ‘2-ships’), with F/A-18E flight leads (Maverick and Rooster) and F/A-18F wingmen (Phoenix w/ Bob and Payback w/ Fanboy). Each aircraft pair will fly in a welded wing formation with one plane aiming the targeting laser and the other plane delivering the weapon. Each pair must accomplish one of two dependent actions:

  • F-18 Pair 1: The first pair will breach the reactor by dropping a laser-guided bomb on an exposed ventilation hatch. (This will create an opening for the second pair.)

  • F-18 Pair 2: The second team will deliver the kill shot.

Model Overview

We suggest that you download the free Excel model and user’s guide for more detail. [1] Here we will summarize the model and its development. It was created with ChanceCalc, from ProbabilityManagement.org, and runs 10,000 trials per keystroke in native Excel. Simply set the parameters involving pilot proficiency and targeting laser dependability on the left side of the screen and read the chance of success off the ChanceOmeter. You may also cycle through each of the 10,000 trials. This model makes use of the powerful Data Table in Excel, which has the potential to bring interactive simulation to tens of millions of users.

Model Development

As mentioned above, two weapons are required: one to destroy the protective ventilation hatch, and the other to destroy the target. Of course, the aim of the weapons is not 100% accurate, and the bombs will land in ellipses that reflect the proficiency of the pilot. So, we started with this aspect, which we thought would be easy to model. It wasn’t, and the next thing we knew we were wading through mathematical formulas on the Internet that would make your head spin (see the user’s guide for references if you are into statistics). But after that was mastered, Connor pointed out that the dispersion error is virtually nil with laser targeted weapons. However, we were saved again by the script writers’ back bends. One of the targeting lasers actually malfunctioned in the movie so we could simulate malfunctions in our model and use the wider dispersion in that case. This led eventually to the BayesOmatic, which was far more consequential than being able to model dispersion ellipses.

The BayesOmatic

This feature is an automated way to perform a powerful technique known as Bayesian Analysis. A future blog will be devoted to this concept, and you can also read more in the User’s Guide. Here we will simply describe how to use this feature to calculate the conditional chances of various events.

For example, with the original model settings, the chance of mission success was about 89%. We can use the BayesOmatic to estimate the chance of success given that both targeting lasers malfunctioned. We see that it is reduced to only 22.8%.

Or how about if you make it back to the deck of the carrier after a successful mission, and the Maintenance Chief says: “Did you realize that both targeting lasers malfunctioned?” “Impossible,” you say. Well not exactly. There is a 2 tenths% chance as shown below.

How can these be so different? Depending on the dispersion ellipses given targeting laser malfunction it is not surprising that the chance of success would be reduced to about 23%. But how about the 0.2%? Well the chance that both lasers malfunction is 10% x 10% = 1%. And we are asking what the chance is that happened, and we also had a successful mission. The bottom line is that Bayesian Analysis is powerful and underutilized, and we that this inspires some of you to learn more about it.

Remember that the Top Gun ChanceOmeter runs in native Excel and requires no macros or add-ins. So, feel free to send it to everyone you know. Or, better yet, send it to everyone you don’t know!

References:

[1] We suggest downloading the model and documentation at either the MORS CoP page or our Military Readiness page.

Copyright © 2023 John Button, Connor McLemore, and Sam Savage