By Sam L. Savage
In this blog I will discuss some technical details of the BayesOmatic in the Top Gun model introduced in the last blog. Those familiar with me know that I would not have called the gauge in the model the ChanceOmeter if I hadn’t been able to purchase ChanceOmeter.com for $11, and while I was out shopping, I picked up BayesOmatic.com for the same low price.
The ChanceOmeter is just a pie chart driven off of two cells on the Calculations page. The green segment is based on a cell created with the Chance of Whatever button in ChanceCalc, and the red segment is simply 1 minus the other cell.
The BayesOmatic is more complicated, especially for people who do not understand Bayesian analysis, which is approximately everybody. It calculates the chance of various outcomes of the mission given specified conditions. For example, we can calculate the chance that the mission would succeed given the malfunction of both targeting lasers.
How it works
Bayes Theorem states that
Probability of event A given event B = Probability of events A and B ÷ Probability of event B
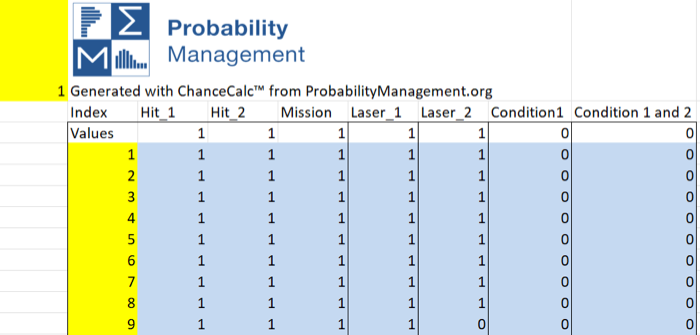
This can be viewed geometrically as the chance that a dart is in region A given that you know it has already hit B as shown. This is elementary to do in a SIPmath model by creating Boolean (0/1) variables that signify that A has occurred, B has occurred, and that A and B have both occurred. This creates three ranges on the PMTable sheet, let’s call them A, B, and A_and_B. Because the results of the 10,000 trials are always live in the Data Table, it is easy to perform Bayesian analysis on the fly and the formula above is simply:
Probability of event A given event B = SUM(A_and_B)/SUM(B)
The actual Top Gun Data Table is shown above. Note that targeting laser 2 failed on trial 9.
The User Form
This model sets up the Boolean variables using user forms on the Top Gun sheet to drive formulas on the Calculations sheet. Even I don’t remember how I did this, but I remember where I did this, which should be enough for you to figure it out on your own.
The user controls were created with the Combo Box Form Control available on the Developer Ribbon (which must be made visible under File, Options, Customize Ribbon.) They interact with cells AF47 to AI52 on the Top Gun Sheet.
The cells above are interpreted by a bunch of formulas I hope you can figure out on the Calculations sheet located as shown below.
Note that there is a second copy of our new trial control on this sheet so you can select individual trials as you figure out the formulas above.
Bayesian Inversion
It is also easy to do what is known as Bayesian inversion. Suppose you’re back on the deck of the carrier after a successful mission, and the Maintenance Chief says: “Did you realize that both lasers malfunctioned?” “Impossible,” you say. Well, not exactly. There is a 2 tenths% chance as shown below. To understand the difference, return to the dart. It should be clear from the figure that the chance of hitting in blue given that you hit in yellow is greater than the chance of hitting in yellow given that you hit in blue.
Copyright © 2023 Sam L. Savage


