The ChanceOmeter
Sounds like chan·saa·muh·tr
By Sam L. Savage
These three Phone ChanceOmeters were created by uploading SIP libraries to ChatGPT and prompting it with what I wanted them to do, as discussed below. If you haven’t tried these, I suggest using the links or QR codes on your phone now. The Help key will provide more information, and the rest of this blog will still be here when you get back

Which two market segments maximize your chance of $100k? Hint: 1 & 2 move together; 3 is independent.

Four final tests before release. Each takes 6 weeks and can run in parallel. Find a release date with a 90% chance of success.

Budgets are padded to reduce exceedance risk. Aggregation creates waste avoidable by pooling. At how many budgets do savings reach $1m?
Measuring Anything
In his acclaimed How to Measure Anything series of books, Doug Hubbard defines measurement as the reduction of uncertainty. He then shows how to use the uncertainty that remains after measurement to guide decisions, including what to measure next.
Improvements in the accuracy and repeatability of measurement have ushered in new epochs of human history.
Consider the chronometer of the 1700s. It measured time accurately enough to enable precise celestial navigation. With a sextant and a star map, you can determine latitude. Add accurate time, and you also know longitude. This opened the door to what we might call the Precise Navigation Age.
The micrometer, which also grew out of astronomical measurement, became accurate enough in the 1800s to manufacture machines such as steam engines to tolerances that prevented self-destruction. No micrometer, no Industrial Age.
Today, a combination of AI and stochastic data brings us the ChanceOmeter, a way to measure uncertainty in an auditable and repeatable manner. I call this the Chance Age, because I bought ChanceAge.com at GoDaddy a few years ago for $12.17.
Modern Finance
However, this period rightfully began with the birth of modern finance in 1952 with the Nobel Prize winning Portfolio Theory of Harry Markowitz and later William F. Sharpe. This was followed in 1973 by Option Theory of Fischer Black, Myron Scholes, and Robert Merton, with its own Nobel Prizes.
Portfolio theory says that fire insurance is a ridiculous investment, unless you have a house in your portfolio to go with it. Don’t invest in single assets but in balanced portfolios such as mutual funds.
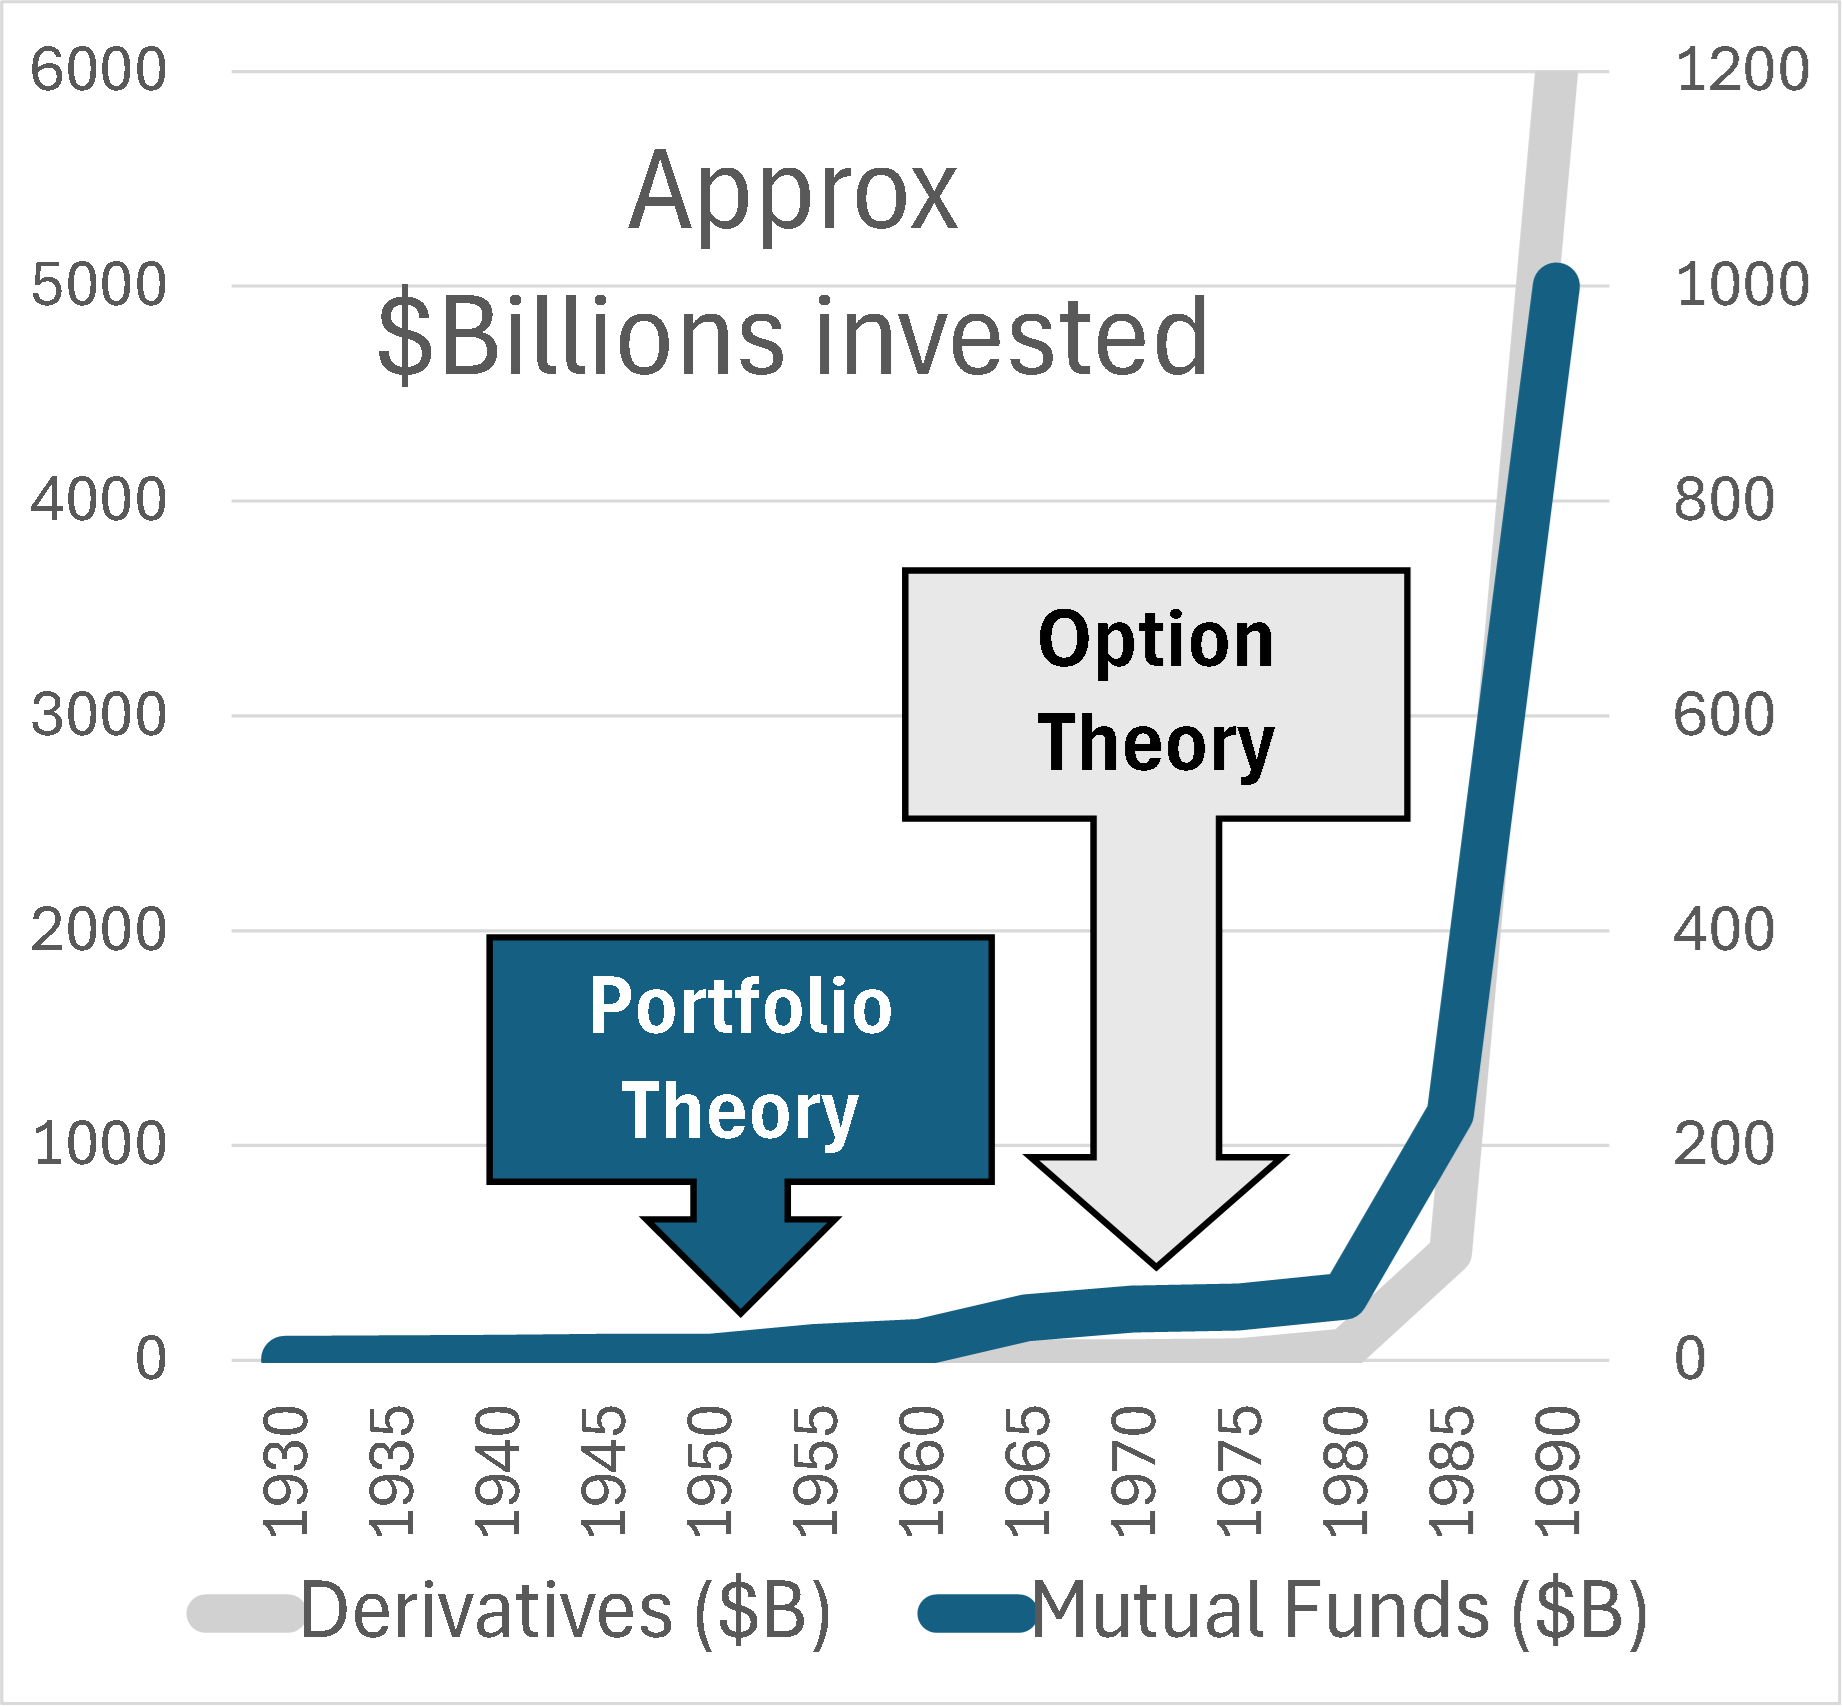
Option theory provided a theoretical basis for pricing financial derivatives such as the options to buy or sell a stock at a particular price on a particular date. Before the famous Black/Scholes equation, trading options was haphazard, like trading rope before yardsticks or tensile strength measures. I have graphed total investments over time in mutual funds and derivatives, relative to these breakthroughs. At first nothing happened and then everything happened.
My favorite aspect of option theory is Implied Volatility, a gauge for directly measuring uncertainty in stock prices. This was truly the first ChanceOmeter.
Financial Engineering and Stochastic Data
The giant growth in activity depicted in the graph was not due to theory alone. The parallel evolution of computers led to explosive growth in Financial Engineering, which applied portfolio and option theory through computer simulation and optimization. This was the direct forerunner of the discipline of probability management, which expresses uncertainty as data that obey both the laws of arithmetic and the laws of probability. The idea is to create a large statistically coherent simulation of all assets of interest. The resulting trials for each asset are then stored in a database as a vector, which I call a SIP (Stochastic Information Packet). For large numbers of assets and trials, the simulation could be slow. But once it is run, arbitrary portfolios and derivatives may be simulated by doing vector arithmetic with the associated SIPs.
Through its Open SIPmath Standard, nonprofit ProbabilityManagement.org has sought to democratize the power of such Wall Street analysis and bring it to Main Street. But wait, there’s less. Large SIP libraries can easily contain tens or hundreds of millions of numbers. In collaboration with Doug Hubbard and Tom Keelin, the nonprofit’s SIPmath 3.0 standard can express SIPs of millions of trials with only a handful of parameters stored as JSON objects.
The Chance Dimension
If you played with the first two ChanceOmeters, you saw that in Stochastic mode, instead of a single input and output, there are 10,000 possible values accessible through a slider. I think of this as a third dimension running into the screen, with 10,000 parallel apps where inputs and outputs change on each sheet. The average of an output is found by summing across the 10,000 trials in this dimension and dividing by 10,000. The chance of an output meeting a criterion is found by counting the number of elements that meet it and dividing by 10,000. The compact 3.0 standard makes the ChanceOmeter practical.
Enter AI
AI is trained on data containing uncertainty, so it is not surprising that it can produce stochastic data using similar statistical techniques. What is surprising is how easily it can create applications like those above.
Below is my first prompt to ChatGPT for the Marketing app:
You are VP of marketing and must decide on two of three market segments. The expected demands in 000s are 80, 70 and 65. But if the total drops below 85 you are fired. As it turns out segments 1 and 2 are from the same demographic, while 3 is independent. OK smarty pants. Can you tell me the chance of falling below 85 for Segment 1 + 2 and Segment 1 + 3? I have attached the 3.0 SIP Library.
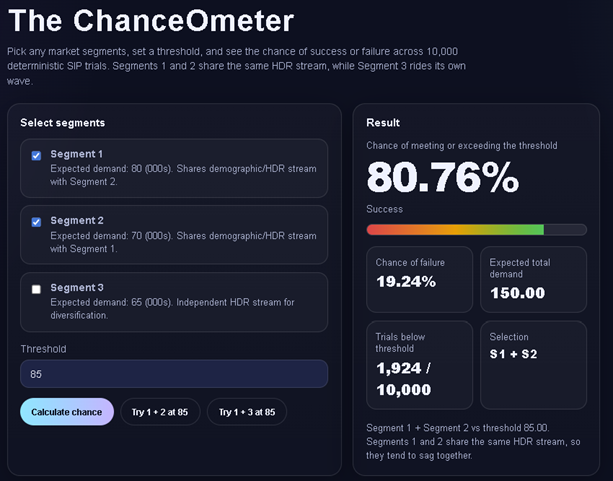
Here is a screenshot of the functioning app it built from that prompt. For final formatting I pointed ChatGPT to an earlier app my programmer had built with the ChanceOmeter dial. But that cool slide bar for the trials was ChatGPT’s idea!