The PRECISE Uncertainty Project

Projected Revenue Estimation from Crowdsourced Information on Statistical Errors

Precise_Uncertainty.png

By Sam Savage (bio in sidebar) and Shayne Kavanagh (bio)

It is difficult for municipal financial officers to accurately estimate their tax revenues, especially during uncertain times such as the recession of 2008 to 2010 and the current COVID-19 pandemic. Customarily forecasts are based on a single number, with no indication of its chances of being met.

We are helping some CFOs of municipalities estimate the chances of meeting projections and are eager to help others as well. Read on to see how you can apply this approach within your own organization.

The goal of nonprofit ProbabilityManagement.org is to deliver statistical measures of uncertainties to non-experts as actionable data, much as power stations deliver energy to consumers as electricity. We have come to call this process chancification, because for the first time, it provides organizations with a standard approach for illuminating the chances of achieving their goals. In the example below, ProbabilityManagement.org teamed up with the Government Finance Officers Association (GFOA), a professional organization of over 21,000 financial managers, to bring chancification to municipal budgeting.

The ABCs of Chancification

The steps of Chancification are:

  • A. Assess the situation

  • B. Bound the uncertainty

  • C. Correlate the variables

  • D. Deliver stochastic libraries

  • E. Employ the results to improve decision making.

A: Assess the Situation
In 2015, GFOA did a study of the accuracy of tax revenue projections from around 30 municipalities. This resulted in a database containing forecast vs. actual revenues, crowdsourced across multiple tax categories, cities, and time periods.  

B: Bound the Uncertainties
The data provided estimates of the bounds on the uncertainties in forecast accuracy. We quantified these with SPT Metalog distributions.

 
Precise Uncertainty-1.png
 

C: Correlate Variables
We used R to correlate the errors between tax categories.

 
Precise Uncertainty-2.png
 

D: Deliver Stochastic Libraries
We created libraries of forecast errors for two economic time periods, one good and one during  the recession.

Precise Uncertainty-3.png

E: Employ Results
We created an Excel dashboard, linked to the library, that lets the user choose tax revenue types from a menu, specify the forecast for each, and then estimate the chances of achieving each tranche of a prioritized budget.
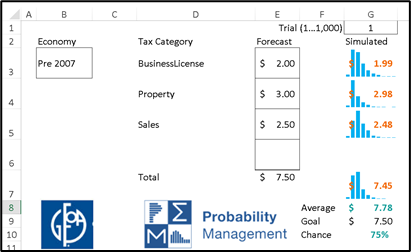
Precise Uncertainty-4.png

Thus, was born 

Projected Revenue Estimation from Crowdsourced Information on Statistical Errors 

or the PRECISE Uncertainty Project. It is indeed precise in the sense that the uncertainties are represented as auditable data; stochastic information packets (SIPs) that obey both the laws of arithmetic and the laws of probability.

Reference class forecasting, developed by Daniel Kahneman, Nobel Laureate in Economcs, is a method of predicting future outcomes based on similar experiences in the past. The PRECISE Uncertainty Project takes this approach further by creating reference class objects: individual interrelated forecasting errors of each revenue types, which may be combined using conventional arithmetic to predict the accuracy of the entire budget.

Last fall, we presented an early version of this work at Risk Awareness Week, a conference organized by Alex Sidorenko, Chief Risk Officer at EuroChem. In fact, it was Alex, a veritable impresario of risk, who first characterized this approach as “crowdsourced.”


We are now seeking volunteers to both experiment with this system and provide more historical accuracy data to expand the study. To learn more about how your organization can start down this path:

For full videos of all five probability management presentations at Risk Awareness Week, visit our Presentations page.

© Copyright 2021 Sam Savage and Shayne Kavanagh

The Axiomatic Fallacy Fallacy

A Commentary on Radical Uncertainty: Decision-Making Beyond the Numbers by John Kay & Mervyn King

by Dr. Sam L. Savage

Which one does not belong?

Airplane_RadicalUncertainty1.jpg
Airplane_RadicalUncertainty2.jpg.png
Airplane_RadicalUncertainty3.png

Answer: The one in the middle, because it does not fly

The Ludic Fallacy

In The Black Swan [i], author Nassim Nicholas Taleb describes seemingly implausible occurrences that are easy to explain after the fact. The classic is the black swan, assumed to be impossible by Europeans until one was discovered by explorers in Australia in 1697. In the book, Taleb defines the Ludic Fallacy as “the misuse of games to model real-life situations.” That is, “basing studies of chance on the narrow world of games and dice." Ludic is from the Latin, Ludus, a game or sport. And I agree that it is naïve to model complex phenomena like economies, weather, and cyber-attacks on such simple uncertainties, but … 

The Ludic Fallacy Fallacy

I define the Ludic Fallacy Fallacy as “attempting to model real-life situations without understanding the narrow world of games and dice." These teach us truths about actual economies, weather, and cyber-attacks just as paper airplanes teach us truths about aerodynamic forces. 

Radical Uncertainty

Radical Uncertainty: Decision-Making Beyond the Numbers by John Kay & Mervyn King [ii] is the Ludic Fallacy on steroids. It is a 500-page critique, not of “the narrow world of games and dice,” but of the narrow axiomatic approach to decision making under uncertainty, which has been widely adopted in economics, finance, and decision science. In keeping with Taleb, I will call this the Axiomatic Fallacy. Since my father, Leonard Jimmie Savage, was one of the founders of the approach, and proposed the pertinent axioms in his 1954 book, The Foundations of Statistics, I was eager to see what Kay and King had to say.

The Axiomatic Approach

My father framed the issue as follows:

The point of view under discussion may be symbolized by the proverb, “Look before you leap,” and the one to which it is opposed by the proverb, “You can cross that bridge when you come to it.”

Looking before leaping requires advanced planning in the face of uncertainty, for which my father sought a formal approach under idealized circumstances. Interestingly, Radical Uncertainty and my own book, The Flaw of Averages, both quote one of the same passages from my father’s work, in which he describes the application to practical problems:

It is even utterly beyond our power to plan a picnic or to play a game of chess according to this principle.

By this, my father meant that the axiomatic approach applied to making optimal choices only in what he called “small worlds,” in which you could enumerate all the bridges you might encounter along with the chances of encountering them. According to Kay and King, both my father and his Nobel Prize winning student, Harry Markowitz, who applied the theory to investments and invented Modern Portfolio Theory, were careful not to claim “large world” results. But the authors complain that for years, many economists and others have pushed the theory beyond its intended limits.

The book makes extensive use of the “small world” vs. “large world” motif. The authors blame the failures of macroeconomic models on “large world” radical uncertainties such as recessions, wars, technological breakthroughs, and things we have not dreamt of yet. These are the sorts of models that did NOT predict the personal computer revolution, recession of 2008, Brexit, Trump, etc. I myself would go further and argue that even in a perfectly deterministic world, many of the large models used in macroeconomics would collapse chaotically under their own weight due to their inherent non-linearity.

I agree that it is naïve to believe you can model “large worlds” in the same way that you can model “small worlds.” But that does not mean that small worlds are irrelevant. As the late energy economist Alan Manne said, “To get a big model to work, you must start with a little model that works, not a big model that doesn’t work.” Thus, to create an airliner, you are better off starting with a paper airplane than an attractive likeness made of plastic blocks.

My role model for bridging the “small world” of theory and the radical uncertainty of the “large world” is William J. Perry, former US Secretary of Defense. Here is a man with a Bachelors, Masters and PhD in Mathematics, who has nonetheless had a remarkably practical career devoted to preventing nuclear war. I once attended an after-dinner speech of his at which someone asked if he had ever built a mathematical model to solve a thorny problem while at the Pentagon. “No,” he responded, “There was never enough time or data to do that. But because of my training I think about things differently.” Amen. Some may see Radical Uncertainty as a refutation of probabilistic modeling. But I see it as an affirmation of Bill Perry’s approach of understanding probability and knowing when and when not to build a model.

The problem is that a book about unsuccessful mathematical modeling is a little like a book about bicycle crashes. If you don’t know how to ride a bicycle, you certainly won’t want to learn after reading about broken skulls, and you will not have learned about the joy and benefits of bicycles. If, on the other hand, you do ride, then you are already aware of the risks and rewards and are not likely to alter your behavior. In either case I believe the authors could have accomplished their goal in fewer than 500 pages.

I share many of the authors’ misgivings about large models, and in fact, similar concerns motivated the creation of the discipline of probability management as I will discuss below. But first I want to address the non-modelers, who may wrongly take the book as a call to just talk about problems through “Narratives,” as suggested by the authors, instead of analyzing them.

An example I use to make this distinction is basic arithmetic (small world) vs. accounting (large world). Just because you know that 1+1 equals 2 does not mean you can be an accountant. On the other hand, you could not be an accountant if you didn’t know that 1+1 equaled 2. But the accountant must also be aware of the radical uncertainties of fraud, money laundering, etc. that appear in the real world of accounting.

I was shocked years ago to discover how many statisticians and economists (and a much larger fraction of graduate students in analytical fields) do not know the equivalent of 1+1=2 in the arithmetic of uncertainty [iii]. That is, when asked to build the simplest of models in the smallest of worlds involving game-board spinners, they come off like accountants who can’t add 1+1. So radical uncertainty can’t take all the glory for bad models, with chaos theory running neck and neck, and ludic stupidity nipping at its heels.

I agree that Kay and King expose a number of valid shortcomings of complex stochastic models. But their main remedy appears to be the power of “Narrative.” As a storyteller I am all for narrative, but I will define the use of narratives that are not informed by probabilistic principles as the Axiomatic Fallacy Fallacy. Below are some concrete suggestions for some of the issues they raise.

What is Going On Here?

A repeated theme of the book is the inability of models based on past data to determine “What is going on here?” Several concepts are embedded in this theme, and the black swan is an example that comes to mind. No amount of data on white swans could ever be extrapolated to create a black one. But there is more to it than that. As a parable, in learning how to fly sailplanes, like most novice pilots, I focused on the “small world” measurements provided by the instruments. However, I was unable to control the plane until my instructor made me focus on the “big world” by looking out the windshield. Only then did I learn to fly by the seat of my pants and assess what was going on. Given the choice of either instruments or a windshield in an airplane, I would take the windshield hands down. But I prefer both, and coordinating them requires connecting the seat of the intellect to the seat of the pants.

Years later, when PCs became so fast that they could perform interactive simulation with thousands of calculations per keystroke, I discovered that “interactive” simulation could similarly provide a gut feel and view out the windshield for the underlying relationships being modeled. I refer to this approach as Limbic Analytics, because the limbic system is the structure that connects the reptilian brain (the seat of the pants) with the rest of the stuff between our ears (the seat of the intellect). John Sterman [iv] of MIT has also had great success in teaching managers how to make better decision in the face of uncertainty with interactive simulation.

The real issue is expecting models to tell you What is Going on Here in the first place. Successful modeling is not a destination, but a journey, in which an evolving family of models eventually “tell you something you didn’t tell them to tell you,” as consultant, Jerry Brashear, puts it. And at that point, if you are lucky, the modeling effort results in the right question, which may lead to What is Going on Here.

Decomposing large problems into smaller problems for which solutions are known or can be calculated

Kay and King contrast unsuccessful models in macroeconomics to the successful engineering models of aircraft and satellite trajectories. They describe how such models are solved through decomposition into smaller models. This is the issue that motivated the discipline of probability management. Deterministic models may be easily decomposed because the numeric results of sub models may simply be aggregated using arithmetical operations. This is not true of models of uncertainty. It is common practice to perform arithmetic on the “averages” of the uncertainties, which famously leads to the Flaw of Averages. In probability management, uncertainties are represented as data, which obeys both the laws of arithmetic and the laws of probability [v]. The data elements, called SIPs (Stochastic Information Packets), are essentially arrays of Monte Carlo realizations, which may be operated on with vector arithmetic to add or multiply uncertainties together. For example, we could subtract the SIP of costs from the SIP of revenue to get the SIP of profit. The result is another array upon which probabilistic operators may be applied, such as the average profit is $1 million, or chance that profit will be less than $800,000 is 30%.

The authors emphasize the need for a pluralism of models

Kay, King, and I completely agree on the impossibility of anyone building a macro model of the economy. Then again, no single person could build the real economy either. This explains the disaster of centrally planned economies and the success of decentralized ones. The authors call for a pluralism of models, which I refer to as decentralized modeling. Again, this is easy with deterministic models, but was nearly impossible with stochastic models before the open SIPmath Standard allowed SIP libraries generated by one model to be shared with many other models. Consider multiple business units of an integrated health care provider operating in the environment of an uncertain pandemic. One should be able to access SIP libraries of uncertain infection growth from any number of competing contagion models. These could then in theory drive the economic models of the business units, producing a second level of SIP libraries. Finally, these secondary libraries could feed a portfolio model that displayed the risks and returns of various combinations of business units.

RadicalUncertainty4.png
 

This allows multiple decentralized “small world” stochastic models developed independently to be aggregated into larger stochastic models. Today the only way to aggregate stochastic models is through large monolithic applications, which, like sandcastles, eventually collapse under their own weight. The decentralized approach is more like Lego blocks, in which individual blocks may be replaced as the world evolves. Will this approach take us all the way to “large world” models? I doubt it, but I have found that the narratives it drives are more compelling than the narratives not based on models.

All Models are Wrong

The statistician George Box said that “All models are wrong, but some are useful.” Dwight Eisenhower, supreme Allied Commander in WWII, said that “Plans are nothing; planning is everything.” I say that models are nothing; modeling is everything, because it will help you be more like William J. Perry and figure out what is going on here. 

On a final note, after my father introduced the two proverbs quoted above, he went on to write: 

When two proverbs conflict in this way, it is proverbially true that there is some truth in both of them, but rarely, if ever, can their common truth be captured by a single pat proverb.

In spite of my father’s warning, I will try, nonetheless. 

The more options you have in place for crossing bridges before you come to them, the less looking you need to do before you leap.

References

[i] Taleb, Nassim (2007). The Black Swan. New York: Random House. p. 309. ISBN 1-4000-63

[ii] Kay, John & Mervyn King. Radical Uncertainty: Decision-Making Beyond the Numbers (p. 399). W. W. Norton & Company. Kindle Edition.

[iii] Savage, Sam L. Statistical Analysis for the Masses in Statistics and Public Policy, Bruce D. Spencer (Ed.), Clarendon Press, Feb 13, 1997

[iv] http://jsterman.scripts.mit.edu/Management_Flight_Simulators_(MFS).html

[v] https://www.probabilitymanagement.org/s/Probability_Management_Part1s.pdf

© Copyright 2020, Sam L. Savage

Flying Into the Eye of the Pandemic

Beware of the Pilot Induced Oscillation (PIO)

by Sam L. Savage

Recently I have been struck by the similarities between managing the pandemic and flying a plane. In both situations you are responding to lagging indicators. Learning about this phenomenon through flying taught me to connect the seat of my intellect to the seat of my pants, which today I call limbic analytics.

In the late 1970s I learned how to fly gliders over the soybean fields just west of Chicago, and it was one of the few things in life that was as good as I thought it was going to be. But it was not easy.

Having built and flown model planes as a kid, and having studied physics in college, I expected flying to come naturally to me. It didn’t. The seat of my intellect and the seat of my pants were often at odds with each other, and they had to reestablish mutual trust a few thousand feet above the world in which they had teamed up to teach me to crawl, walk, run, swim, and ride a bike.

This mind/body link is described in detail in my book The Flaw of Averages in Chapter 5: The Most Important Instrument in the Cockpit. And because of the pandemic and the lagged indicator problem, it has recently been front of mind for me.

You can’t learn how to ride a bicycle by reading about it, and the same is true for flying. My friend Ron Roth and I created a flight simulator where you can experience this lesson in limbic analytics for yourself. In any plane, if you fly too slowly, you will stall and lose control, and if you fly too fast, you will rip the wings off. Not surprisingly, these unfortunate possibilities weigh heavily on the mind of the student pilot, who tends to focus their gaze on the airspeed indicator. They shouldn’t.

In a glider, or normal airplane at constant power setting, the speed depends on the pitch up or down of the nose. Imagine that you are creating an on-demand roller coaster in the sky just in front of you. Pull back on the stick and the nose points up, slowing you down. Push forward and the nose points down and the speed picks up. The problem is that because the speed lags the pitch of the nose, the novice pilot with their eye on the airspeed indicator tends to make a growing set of overcorrections, which can lead to loss of control (see video).

This is known as pilot induced oscillation or PIO, and the solution is to NOT look at the airspeed indicator, but to focus on the angle of the nose above the horizon, which is a leading indicator of airspeed. That’s why the most important instrument in the cockpit is the windshield!

But, where were we? Oh yes, the pandemic. The death rate is lagged from the ICU patients, which is lagged from those admitted to the hospital, which is lagged from those infected, which is lagged from the infection rate, which we can’t really see. So, this is not an easy plane to fly. If you don’t believe that it is difficult to maintain control through lagging indicators, try flying our simulator in various modes and compare the graphs of your attempts to control the speed to the graphs of the infection rates from rt.live, a website that plots current infection rates by state. You will find an uncanny resemblance.

Graphs from rt.live

Graphs from rt.live

And how about flying the economy? It’s even harder! Mathematically, contagion growth is a piece of cake compared to an economy. Oh, and how about influencing human behavior in the face of unknown threats? That’s harder even than the economy, and all three of these unstable airplanes need to be flown in tight formation.

The pandemic equivalent of the angle off the horizon is the infection rate. The economic equivalent involves manufacturing, inventory levels, housing permits, etc. Public behavior is traditionally influenced by the news media and politicians who are often at odds.  

So, what can our nonprofit do to help?

Even without political strife, the communication of uncertainty between epidemiologists, economists, reporters, and politicians is usually reduced to average outcomes, as in the Flaw of Averages. Our nonprofit has now brought the war on averages to the pandemic by helping the stakeholders unambiguously communicate the uncertainties faced in their own domains. See our previous blog posts:

If you want to learn more about our efforts, email us at info@probabilitymanagement.org.   

© Copyright 2020 Sam L. Savage

Simulation Trials vs. Scenarios

by Sam L. Savage

ShakingLadder.png

Justin Schell is part of a team bringing the discipline of probability management to Highmark Health, an $18 billion, Pittsburgh-based integrated healthcare firm. So far he is getting a good reception from a number of quarters in his organization. However, as he has introduced simulation trials to management, he has encountered confusion with the concept of scenarios. Justin invited me and Dr. Sarah Lukens, a Data Scientist at GE Digital, to discuss this with him and record our conversation in a video, which he has just posted here.

From my perspective, if simulating a business plan before investing in it is like shaking a ladder before climbing on it, then scenarios correspond to where you will unexpectedly find your ladder when the climbing begins--will it be beside your house, over broken beer bottles, next to a shark tank, etc.?

Although scenario analysis was made famous by Royal Dutch Shell’s fortuitous preparedness for the collapse of the former Soviet Union, Reidar Bratvold, a Professor of Investment & Decision Analysis at the University of Stavanger in Norway, points out a potential big problem with the approach. By focusing on a few, causal stories, it diverts attention from “a broader, more systematic representation of the decision situation.” In this way, there is the potential that it “grossly overestimates the probability of the scenarios that come to mind and underestimates long-term probabilities of events occurring one way or another.” Bratvold also compares scenario analysis to risk matrices, which many people consider worse than useless by providing a palliative that lulls one into the sense that they have done risk management.

Both scenario analysis and risk matrices are often used in an attempt to do probabilistic analysis without using probability. That is like trying to learn how to swim without getting wet. Understanding probability, or what I call the arithmetic of uncertainty, has to come first. Then when you conjure up a new scenario for consideration, you can address whether it is more or less likely than an asteroid strike. I think of simulation and scenario analysis as dual to each other. You will fall into the traps described by Bratvold if you don’t understand the probabilities involved, and you may end up simulating the wrong things if you haven’t explored the parallel universes in which you might find yourself.

Through simulation analysis, new scenarios may suggest themselves and vice versa.

© Copyright 2020, Sam L. Savage

Scenario Analysis on Steroids

New 4.0 Enterprise SIPmath Modeler Tools

EnterpriseToolsRibbon_full.png
 
Herman Kahn

Herman Kahn

Scenario Analysis

Scenario analysis was invented by futurist Herman Kahn in the 1950s at the Rand Corporation. He was a friend of my dad’s and I remember him vividly from early childhood as energetic, humorous, and rotund. Perhaps not traits one would expect in the author of On Thermonuclear War, his controversial 1960 treatise of war in the nuclear age, which introduced the Doomsday Machine. In fact, Kahn is one of the characters upon whom Dr. Strangelove (of the movie) is based.

Scenario analysis involves forecasting major political and economic shifts through a few self-consistent narratives around potential futures. One does not specify probabilities of these scenarios up front but uses them to guide analysis into the unknown.

Scenario analysis has been widely used at Royal Dutch Shell and has been credited with preparing the company for the collapse of the Soviet Union. Here is a short docudrama of how it occurred.

“What would happen if the Soviet Union Collapsed?” … “Get out of town.” … “But what if it did?” … “That’s ridiculous!” … “But what if it did?” . . . . . . . . . . . . . “Maybe we’d better think this through.”

I am all for the out-of-the-box thinking that scenario analysis encourages. But if each of your handful of scenarios is rooted in the Flaw of Averages, where are you? Among other new features, the latest SIPmath Tools make it easy to combine interactive Monte Carlo with scenario analysis for the best of both worlds.

An Application – Climate Smart Agriculture

We have been assisting a team of environmental scientists at World Agroforestry (ICRAF) in exploring sets of climate smart agriculture projects in Africa, which will be the subject of a future webinar. Because all of these projects coexist in the same uncertain environment, there are strong portfolio effects, which can be modeled well with coherent SIP libraries. But beyond the sorts of uncertainties that are amenable to Monte Carlo simulation, there are potential world scenarios involving political upheaval, carbon pricing, etc., for which it is difficult to estimate probabilities. Therefore, we added the capability to the SIPmath Modeler Tools to run the same simulation through multiple experiments. You can then quickly scroll through either different portfolios of projects in one world scenario, or the same portfolio in multiple scenarios as shown in the graphics below.

Changing Portfolios

Changing Portfolios

Changing Scenarios

Changing Scenarios


Free Webinars

Brian Putt, our Chair of Energy Applications, and I will be offering a series of ongoing free webinars on the new SIPmath Tools. For a limited time, attendees will have the option to purchase the Enterprise Tools at a 30% discount, $150 off the regular price of $500. The first three webinars are listed below.

Introduction to the 4.0 Tools

This webinar will start with the basics of using either the Free or Enterprise versions of the SIPmath Modeler Tools for Excel. We will then briefly describe the exciting new features of the 4th generation tools below.

  • Advanced HDR generator from Hubbard Decision Research

  • Scatterplots of input and output cells

  • Multi-scenario simulation and multi-scenario libraries

  • Save and retrieve PMTable sheets for advanced analysis

Scenario Analysis on Steroids

This webinar will show how to create scenarios based on several variables such as discount rates, price levels, political upheaval, etc., which may easily be run through a single simulation model. The new Repeated Save command, coupled to Danny O’Neil’s “Enigma” formulas, automatically creates SIP Libraries containing multiple scenarios. These may be accessed by other models that can in turn filter the results by scenario. Topics include:

  • Using the HDR Generator to coordinate models

  • The “Enigma” formulas for performing experiments with arbitrary numbers of variables

  • The Repeated Save command

  • Filtering the results on Input and Output

More Power to the PMTable

The PMTable sheet is the heart of SIPmath in Excel, as it is the location of the Data Table that allows the simulation to run in native Excel. This webinar will show how to use the new “Save PMTable” command, which lets you save multiple versions of your analysis. For example, you may perform a multiple output simulation, save the resulting PMTable, then run a single output multiple experiment, save that PMTable, then return to the original. This also enables complex analysis techniques to include: 

  • Storing a base or reference case for comparison

  • Sensitivity analysis

  • Tornado diagrams

  • Critical path identification

© Copyright 2020 Sam L. Savage

COVID-19: The Solution is Obvious

Regardless of Your Political Position

ObviousBlog1.png

by Sam L. Savage

The entire world is facing tradeoffs between public health and economics. But at a high level it is obvious what to do. We must choose between rational tradeoffs that balance these two objectives (the O’s in the graph above) or decisions that could be improved in both dimensions (X’s). There are many more X’s than O’s, and the O’s are hard to find. But we have the analytical technology to find them and should start now.

When we do find the O’s, some will favor healthcare outcomes, some economic outcomes, and some will be in between. So how should we choose among them? The way our country has traditionally made decisions that impact various stakeholders differentially, with democracy. Regardless of your politics, you want an O, not an X, and it’s nice that we can all agree on something.

So, what is the technology that can help us find the O’s? It is called stochastic optimization, and it has been used in the financial and insurance industries for decades. But how can you optimize when everything is so uncertain?  The word stochastic means explicitly modeling the uncertainty, as opposed to rolling it into a single average number as in the Flaw of Averages.

Modern Portfolio Theory

In the early 1950’s, future Nobel Prize winner Harry Markowitz was writing his doctoral dissertation on investing at the University of Chicago’s Department of Economics. The academic literature at the time prescribed maximizing average return. But Harry realized that this would have you investing all your money in the single hottest stock in the market. This flies in the face of not putting all your eggs in one basket. So, he explicitly added a new dimension to the investment problem: risk, measured as the uncertainty in return as shown below. Every investment is a point on this graph, and Harry calculated what he called the “Efficient Frontier,” an optimal risk/return tradeoff curve, arcing up from the origin.

ObviousBlog2.png

This was the first stochastic optimization of which I am aware.

No rational investor would choose an investment to the right of the curve because going straight left to the curve would yield an investment with lower risk at the same return. Going straight up to the curve would yield an investment with more return at the same risk. So, an investment to the right of the curve is just plain nuts. Because the curve was found through optimization in the first place, nothing can exist to its left. And people first detected that Bernie Madoff was a fraud because he was promising the impossible on this graph.

A rational investor might pick any point on the curve depending on their risk attitude as shown. Harry’s 1952 paper on Portfolio Selection led to Modern Portfolio Theory (MPT), which revolutionized Wall Street, led to other stochastic optimization methods,  and ultimately garnered him a Nobel Prize in Economics in 1990.

SIP Libraries

In 2006, I helped Royal Dutch Shell apply MPT to finding efficient frontiers of risky exploration projects. A small prototype model (shown below) has risk on the horizontal axis and expected return on the vertical as in Harry’s original approach. It is available for download here. 

Shell.gif

The Shell portfolio model was assembled from smaller models of the individual exploration projects using the concept of the SIP (Stochastic Information Packet). This is a data structure that represents uncertainties as auditable arrays of Monte Carlo trials and metadata. The project SIPs were interactively aggregated into portfolios in Excel, allowing managers just two steps below the CEO to add or remove projects in real time and see the resulting risk/return tradeoffs. The idea of SIP libraries, which had its foundations in the fields of financial engineering and insurance, has now been democratized by 501(c)(3) nonprofit ProbabilityManagement.org, of which Harry Markowitz and I were founding board members in 2013.

COVID-19

Meanwhile, back in the pandemic, there is so much uncertainty about the progression of the contagion, the effects of the disease itself, and human behavior in the face of it all, that the Flaw of Averages abounds.

Again, in theory, stochastic optimization can be applied to this problem, as we applied it at Shell. But due to the size and complexity, a single model would collapse under its own weight before producing useful results. In fact, I am not sure a single team of modelers could do it.

So, our nonprofit has begun experimenting with an approach that would allow teams in diverse disciplines to collaborate on this problem by decomposing it into manageable chunks. Models of contagion, government policy, and economics created separately in such common environments as Excel, R, and Python could be snapped together like Lego blocks using common SIP libraries. We have been working with colleagues at Kaiser Permanente and other healthcare organizations on this project and are actively seeking other potential partners.  

ObviousBlog4.png

To leave you with something tangible, the blue curves in the graph display what we call the sample paths of a contagion model, with one for each of hundreds or thousands of simulated uncertain outcomes. Taken together, they can help us find the O’s. The red curve is the simulated “average” pandemic, which leads to an X.

© Copyright 2020 Sam L. Savage

Balancing Broomsticks

Coming Out of Coronavirus Captivity

by Sam L. Savage

We have met the enemy and he is us.

The symptoms of COVID-19 range from not even knowing you have it to a death sentence, depending on the patient. Writing on this disparity in the Atlantic, Dr. James Hamblin says that COVID-19 is “proving to be a disease of uncertainty.” He quotes Dr. Robert Murphy, an infectious disease specialist at Northwestern, who was in the trenches of the early HIV epidemic.

“As Murphy puts it, when doctors see this sort of variation in disease severity, ‘that’s not the virus; that’s the host.’” Apparently the virus can make some people’s immune systems have a panic attack called a cytokine storm.  This can be brought on by a number of diseases and other conditions, but because the body is fighting itself, it’s tricky for medicine to know whose side to take, and it is often fatal.

Graphic from The Conversation

Graphic from The Conversation

Of course, medical science has made huge strides since 1918 (the year of the last big pandemic), or since 2018 for that matter, which we hope will help with COVID-19. In a recent article in the Economist on Learning to fight the next pandemic, Bill Gates points to recent “giant leaps in vaccinology.” In particular, he cites mRNA vaccines that teach your body to create its own immunity, rather than injecting antigens for your immune system to tussle with. He identifies two other relevant areas of medical advances: diagnostic testing, which is our ultimate gauge of pandemic control, and antiviral drugs, which will reduce the impact of contracting the disease.

Update

These uncertain developments may take months or years, but there are also uncertainties being resolved day by day, that shed light on the pandemic. On March 26, 2020, which seems like a lifetime ago, I posed three questions about COVID-19 and wondered if they would be resolved in upcoming weeks. My questions then, and what we have learned about them in the past month, appear below.

  1. What percentage of the total population has been infected?

    As of my March blog, I had only seen statistics from sick people (a biased sample, which underestimates the total). What do we want today’s total infected to be? 100%, of course. If we all had the virus, we could just go back to our work and play. Furthermore, it would imply a lethality rate comparable to infected hangnails. But 100% of us have not been infected. The good news, however, is that recent studies show that the percentage is perhaps 50 times larger than indicated by the previous studies on symptomatic patients. The New England Journal of Medicine reported on April 13 that of 215 women who delivered babies in two New York hospitals between March 22 and April 4, 15% tested positive, and over 80% of those were asymptomatic. The bad news is that 15% is way below herd immunity levels. But these results, if they are applicable to the general population, show a vast reduction in the effective lethality of the disease.

  2. How badly will our healthcare system be overwhelmed?

    Back in March, the worst had not hit, and there were visions of one giant wave of infection crashing across the country, swamping every ICU and ventilator at once. The lethality increases by perhaps an order of magnitude if you are really sick and there is no room for you in an ICU. Now we see that both the timing and intensity vary by geography, allowing the mutual sharing of resources with the ebb and flow of the contagion across regions. The ICU problem is now being mitigated with time and money. And I would like to put in a plug for combat pay for our healthcare workers on the front lines, our most valuable resource, who are being disproportionally impacted.

  3. When will we develop a test for antibodies?

    Was I really asking this only a month ago? Antibody tests are all over the news today. However, you need to read the fine print. For example, one such test warns that “Positive results may be due to past or present infection with non-SARS-CoV-2 coronavirus strains, such as coronavirus HKU1, NL63, OC43, or 229E.” The New York Times has a good podcast on the current state of both diagnostic and antibody testing, but stay tuned, as things in this area are evolving fast.

    Furthermore, according to the World Health Organization, having antibodies does not necessarily provide immunity. However, with such widely varying outcomes from the disease, having antibodies at least proves that if you catch it again it won’t be your first rodeo, and that you did pretty well in your last one. 

Getting Back to Work – An Unstable Equilibrium

There is now a healthy debate about the risks to the economy of staying shut in too long vs. the risks to our health of opening up too soon. We won’t just make a single decision as a nation and charge ahead regardless of outcome, but instead we will monitor the situation location by location and adjust as needed. But controlling a pandemic is not a stable equilibrium, like driving a car that tends to go straight when you let go of the wheel. It is unstable, like balancing a broomstick on your hand. You must continually monitor its motion, and if it falls over it will rekindle the pandemic. Furthermore there are three additional complications. First, there are many brooms, and if you let one fall over it may spread infection to the others. Second, the positions of the brooms are monitored by clinical testing and contact tracing, which we are still not set up to carry out on a large scale. Third, instead of observing the positions of the brooms, we are seeing a delayed video of the positions, because it takes a couple of weeks for new infections to show up. In short, we don’t know how it will turn out.

My Next Questions

Below are three more questions I hope we get answers to by next month.

  1. How will the economy opening experiments go?

    Different experiments are being tried in different countries, states, and geographic regions and there will be both health related and economic lessons from each. In particular, Brazil’s relaxed approach and those of Sweden, Denmark, and New Zealand, as described by the BBC, are worth watching. Who will be successful at balancing their broomsticks? And when some inevitably fall over, how big a second wave will they make?

  2. Do antibodies make us immune?

    Hopefully in a month we will have a better understanding of this issue. Depending on what we learn, we may be able to offer immunity passes for people to head out into the world again.

  3. New therapies

    Two things have moved in the right direction since March 26. First, we continue to build our ICU capacity, and second, due to the higher background prevalence of COVID-19, the lethality is less than we first thought. Now imagine that through survivor plasma, some new antiviral drug, or a way to treat cytokine storm, we further reduce the lethality while continuing to grow our capacity. Might we reach a tipping point at which could open the economy much faster?  We are not there yet, but what will things look like in a month?  

In March I wrote that demonstrating some control over the pandemic would be rewarded by the financial markets. Since then we clearly have been able to flatten the curve by hunkering down, and in the last month the Dow has risen about 10%. That would be great in normal times if that’s any comfort.

But just as uncertain as COVID-19 are the economic impacts of shutting in. The next month will reveal much in this area as well, hopefully enabling us to make better econopandemic decisions than than we can now.

© Copyright 2020 Sam L. Savage

Riding My Book

In which I provide a loose translation of Jensen’s 1906 “Inequality” paper from the original French.

Riding6.gif

by Sam L. Savage 

At a time when the coronavirus pandemic has put many people out of work, a number of people I know find themselves busier than ever. I am blessed to be in the latter category and my heart goes out to those in the former. Thank you Thomas Paine, Milton Friedman, and Andrew Yang for the continuing dialog on Universal Basic Income. I hope those checks start arriving soon.

Why are the rest of us so busy? Here are some anecdotal explanations heard from friends. “I no longer commute.” “I used to leave work at the office, but now I wake up and start working and the next thing I know it’s 10PM.” “Our Zoom meetings aren’t as effective as face to face discussion, so everything takes longer.” “The university has just switched to totally online teaching without warning and there are tremendous setup issues.”

In my case the transition was easy. I have worked from home since 1997 and am used to filling up 16 hours a day with procrastination and a little work. I have stayed up to speed on teleconferencing technology and had already been teaching some of my Stanford classes via Zoom. The worst thing so far has been the closing of the beloved YMCA, 300 steps from my house, which I used to visit twice a day.

So why am I so busy? Recall that I am the primary publicist for Jensen’s Inequality, (which I have rebranded as the strong form of the Flaw of Averages). There is a link below to Johan Ludwig William Valdemar Jensen’s original 1906 paper from Acta Mathematica. If you can’t read mathematics and French at the same time, I have provided a loose translation below.

Loose translation of Jensen’s 1906 paper:

Sur les fonctions convexes et les inégalités entre les valeurs moyennes

Jensen.jpg

Seventy-six years from now when they invent electronic spreadsheets, most people will be uncertain about the numbers they are plugging in, so they will just enter the average values. And a majority of those dumbasses won’t have a clue that the numbers coming out are generally not the average outputs.

And by the way, there are no exemptions during pandemics when the extra uncertainty only accentuates this problem. So remember, boys and girls, my inequality works 24/7, 365 days a year, rewarding options traders and others who thrive on uncertainty, and punishing those who insist on basing decisions on single average numbers.

Jensen must be turning over in his grave to see a billion people ignoring his advice today. But where was I?

Oh yes. As Jensen predicted in 1906, one reason I’m so busy is that the pandemic has created a target-rich environment for his famous inequality. But on top of that, this is the perfect time to finally push out the second edition of my book on the Flaw of Averages. So to create extra time in my day, and maintain my exercise routine, I constructed the CVWP (cardio-vascular word processor) out of spare parts, pictured above. You might think it would be hard to type and spin at the same time. First of all, as it turns out, a lot of what I am doing at this stage is proofreading, which has led to an interesting discovery. I am a slow reader, but if type something like this, leaving out the word “I,” by using Microsoft Word’s Read Aloud function, I can proofread quickly with a part of the brain that was not guilty of the original typo, all the while spinning my heart out. When I do find a problem, I slow up a bit and have plenty of keyboard bandwidth to fix it with redlines on. For the real diehards, the Dictation feature allows you to speak into Word as well, but I am not yet fully proficient at that.

For those interested in updates to the book, you may visit FlawOfAverages.com to explore some new material. In particular there is a link to over 20 annotated SIPmath models in Excel covering a wide range of applications.

Copyright © 2020 Sam L. Savage

Introduction to the Value of Information And the XLTree™ Software

by Dr. Sam L. Savage

A classic example of the value of information involves the decision of whether or not to purchase a $25 umbrella in the face of a known 10% chance of rain. If it does rain and you do not buy the umbrella, you will do $100 damage to your suit. This is displayed in the decision tree below, in which, in keeping with tradition, a square represents a decision and a circle represents an uncertainty.

VOIBlog1.png

If you purchase the umbrella, you incur a $25 cost regardless of weather (upper branch). If you take your chances, there is a 10% chance of a $100 penalty, for an average of -$10. The decision tree software is no fool and goes for an average of losing $10 over a sure loss of $25 (green path).

The tree above was created with the XLTree Excel add-in (a beta version of which will be available with documentation to all participants in my upcoming webinar before we post it on our Tools page). This software was developed for my textbook, Decision Making with Insight, which was published in 2003. I donated XLTree to ProbabilityManagement.org, and updated it to use the Excel ribbon interface as shown below.

VOIBlog2.png

But back to the value of information. You have already decided not to buy the umbrella when a fairy walks down a moon beam and says, “I can tell you whether or not it will rain tomorrow.” So you say, “Cool, give me the scoop.” And the fairy says, “We haven’t worked for free since the 20th century, that’ll be two bucks.” Is it worth it? Here’s how to think about the value of information.

Without the information, you need to DECIDE what to do and then FIND OUT whether or not it will rain.

With the information, you will FIND OUT whether or not it will rain and then DECIDE what to do.

This is called flipping the tree, which you can do with the software. And when you flip the tree above you get the figure below.

VOIBlog3.png

The fairy will tell you that it will rain with 10% probability and that it won’t rain with 90% probability because those are the true probabilities and fairies don’t lie. Now, 10% of the time you will buy the umbrella for $25 and save your suit, while 90% of the time you will do nothing (see the green lines representing your decision under each case). On average you are out $2.50. So, what’s the information worth? You went from an average of average cost of $10 down to $2.50, an information value of $7.50. The Fairy’s offer of two bucks is a steal.

The case above describes what is known as the value of perfect information. Had you received the tip from a gnome (who are known to lie occasionally), we would have applied the value of imperfect information and it would have involved a more complicated tree.

© Copyright Sam Savage 2020

The Value of Information About COVID-19: What Will the Information We Learn In the Next Two Weeks Be Worth?

by Sam L. Savage

The Coming Surge in the Value of Information

Video source: Khan Academy

Because we are not having a probabilistic discussion of COVID-19 (which it is our mission to correct), most models are based on single number assumptions for infection rate and other critical factors. This, of course, leads to the Flaw of Averages, about which I have written in previous blogs. But in addition, point estimate thinking masks the economic benefit in information value we receive every day that we learn more about this pandemic.

It’s as if we are living in a thriller TV series, and I have a feeling that the next few weeks will provide a lot of reveals. It is complicated to project the future in any event, and I suggest the excellent video above on predicting the impact. But remember that this model, like all the others, will be greatly impacted by things we learn soon.

Most of our current data on this subject is biased because it is taken from patients who are exhibiting symptoms. John Ioannidis argues that we are making decisions without reliable data. An un-mentioned benefit of flattening the curve is that it buys time to reduce some of the uncertainty about this pandemic and alter our decisions.

Some Uncertainties That May Be Reduced

What information could we learn in the next couple weeks, and what could it be worth? Here are a few observations.

1. What percent of the population has already been infected? A recent Wall Street Journal article reports that when they started testing professional basketball players, several, including Kevin Durant, were positive but had no symptoms. They write,

“This small, accidental experiment echoes what more scientific studies are finding: People with no symptoms are carrying the sometimes-deadly virus without knowing it—and might be inadvertently helping it spread.”

Remember that for information to have value it must have the potential to change a decision. As we learn more about the rate of infection and severity of symptoms or lack thereof of the population at large, it could change our decisions about who stays shut in. It may be good news in the sense of indicating herd immunity, which would put a damper on the overall numbers who could become acutely ill.

2. Will we truly overwhelm our healthcare facilities? The view that the entire country is having the same pandemic is a spatial version of the Flaw of Averages. Because the degree of criticality will vary from place to place over time, we may have the option to move ventilators, army field hospitals, and perhaps even healthcare workers from place to place as needed. This could have a big effect on overall fatalities, and I don’t see how this could be accomplished without Federal coordination. Any such victory would not only save lives, but also signal that we are regaining control, which the markets would love.

I presume that if we conquer the critical care shortfall, we will be encouraged to stand at the bottoms of escalators with our tongues on the handrails to get this ordeal behind us as quickly as possible. 

On the other hand, if fatalities spike in one or more of our cities, as they did in Italy and Spain, the tragedy is likely to change behavior in other cities and increase our tolerance for hunkering down.

3.  Will we develop a test for immunity? Current tests indicate whether you are shedding the virus or not. But researchers are hard at work on tests to determine if you have antibodies that indicate you are immune. This could be a game changer. Imagine that we knew a large fraction of the population was infected with the virus, but as described in 1 above, are symptom free and don’t know they had it. A test that proved immunity would identify the people who could go back to work, to restaurants, movies, and airports, and reboot the economy. Surely that would be worth $1 trillion about now. I can imagine being issued a license to mingle, once you have tested for the antibodies.

Graph by Connor McLemore

Michael Levitt, a Stanford Nobel Laureate, recently told the LA Times that he “sees signs that the United States may get through the worst of the COVID-19 pandemic well before many health experts have predicted.” And ProbabilityManagement.org’s Chair of National Security Applications, Connor McLemore, points out in a recent post that perhaps we are seeing an acceleration of positive tests because we are testing so much now, but that the virus itself may actually be slowing. He created a scatterplot below from University of Oxford data, comparing by country confirmed cases of COVID-19 to number of tests performed, as explained in further detail in his post.

Let’s Not Squander the Information

Now back to flattening the curve. If things turn out better than the direst warnings of the healthcare professionals, will it have been a bad decision to shelter in place? Do you own a house? Did you buy fire insurance last year? Did your house burn down? No? I guess you won’t waste your money on that again!

No. Buying insurance is a good decision for most of us, and regardless of what happens, flattening the curve was a good decision for now. But as questions like the ones above are answered, we must be prepared to change our decisions, or we will squander the value of the information that we will be gaining in boatloads over the next few weeks.

© 2020 Sam L. Savage