
by Sam Savage
According to George Bernard Shaw, “The single biggest problem in communication is the illusion that it has taken place.” The poster child for this conundrum is the word risk.
You worry about the risk of XYZ stock going down, but I’ve shorted it, so I worry about XYZ going up. I offer you $200,000 in cash or a coin toss worth 0 or $1 million and you take the cash. Bill Gates risks the coin flip.
Bottom line: risk is in the eye of the beholder.
Yet most risk management techniques serve up “risk” as a single number, or worse, a color on a heat map, which is blind to risk attitude. No wonder Doug Hubbard, author of The Failure of Risk Management: Why It’s Broken and How to Fix It, argues that most current methodologies “are no better than astrology.” Both Doug and I agree that a promising approach is the computer simulation of uncertainty, but most risk simulations are siloed, and cannot be networked together into integrated systems. This will take a degree of standardization which is just emerging, and which will need to take place on multiple levels.
As an analogy, consider the standardization of financial statements.
Uniform Formatting defines how things look (let's go with the green stripe).

Formatting helps organize information visually, but does little else. The risk management version is a heat map. Don’t get me started!

Uniform Calculations define what things mean.

Risk calculations are typically done three ways:
Not at all
Doug Hubbard and co-author Richard Seiersen deride calculations with heat maps as “Orange times fish plus purple times birds equals Pee Wee Herman.”With averages
The good news: averages are easy to calculate with. The bad news: they lead to the Flaw of Averages. I will address this in a future post, but you’d better use an incognito browser when you read it.With simulations
Simulations preserve the uncertainty of risky situations, allowing results to be viewed according to the beholder’s individual risk attitude.
Here an important calculation is:
Risk = Likelihood of Failure x Consequence of Failure
If you treat Likelihood and Consequence as single numbers in this expression, stay tuned for my upcoming diatribe. If you use it in a simulation which conveys uncertainty, then game on!
Uniform Representations define how things are communicated.
Hah! You thought we were done. But if you can’t communicate the results in an actionable way you are stuck in your own silo.
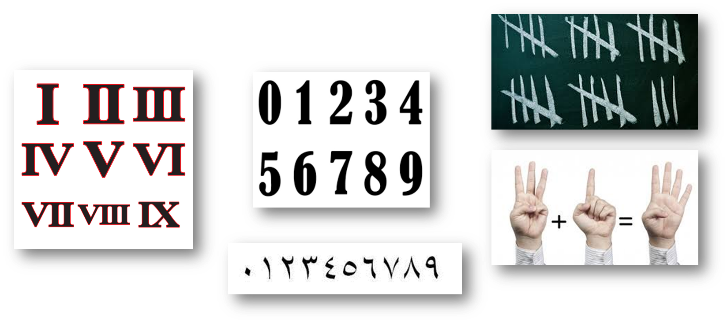
Hindu-Arabic numerals are so entrenched that we don’t even realize we have a choice. At ProbabilityManagement.org we are working with others on an analogy for conveying uncertainty between simulations.
Our open SIPmath Standard represents uncertainties as arrays of simulated trials called Stochastic Information Packets (SIPs). Doug Hubbard is developing a family of portable random number generators that have already been adopted by the SIPmath Tools available on our website, and may eventually enable massive networked simulations that communicate across the economy. Tom Keelin's new representation for probability distributions, called Metalogs, also appears in our tools. I will devote a future blog to Tom’s mathematically elegant and practical invention.
The theme of our Annual Conference in San Jose on March 27th and 28th is Standardized Risk and Doug, Tom, and I will be presenting. I hope you can join us.
Do you have ideas of your own that you want to share with the world? Send us an email.
Sam L. Savage
Executive Director
